Operations Marketing - Tracking Campaigns
Navigate to the "AWS Quicksight" screen
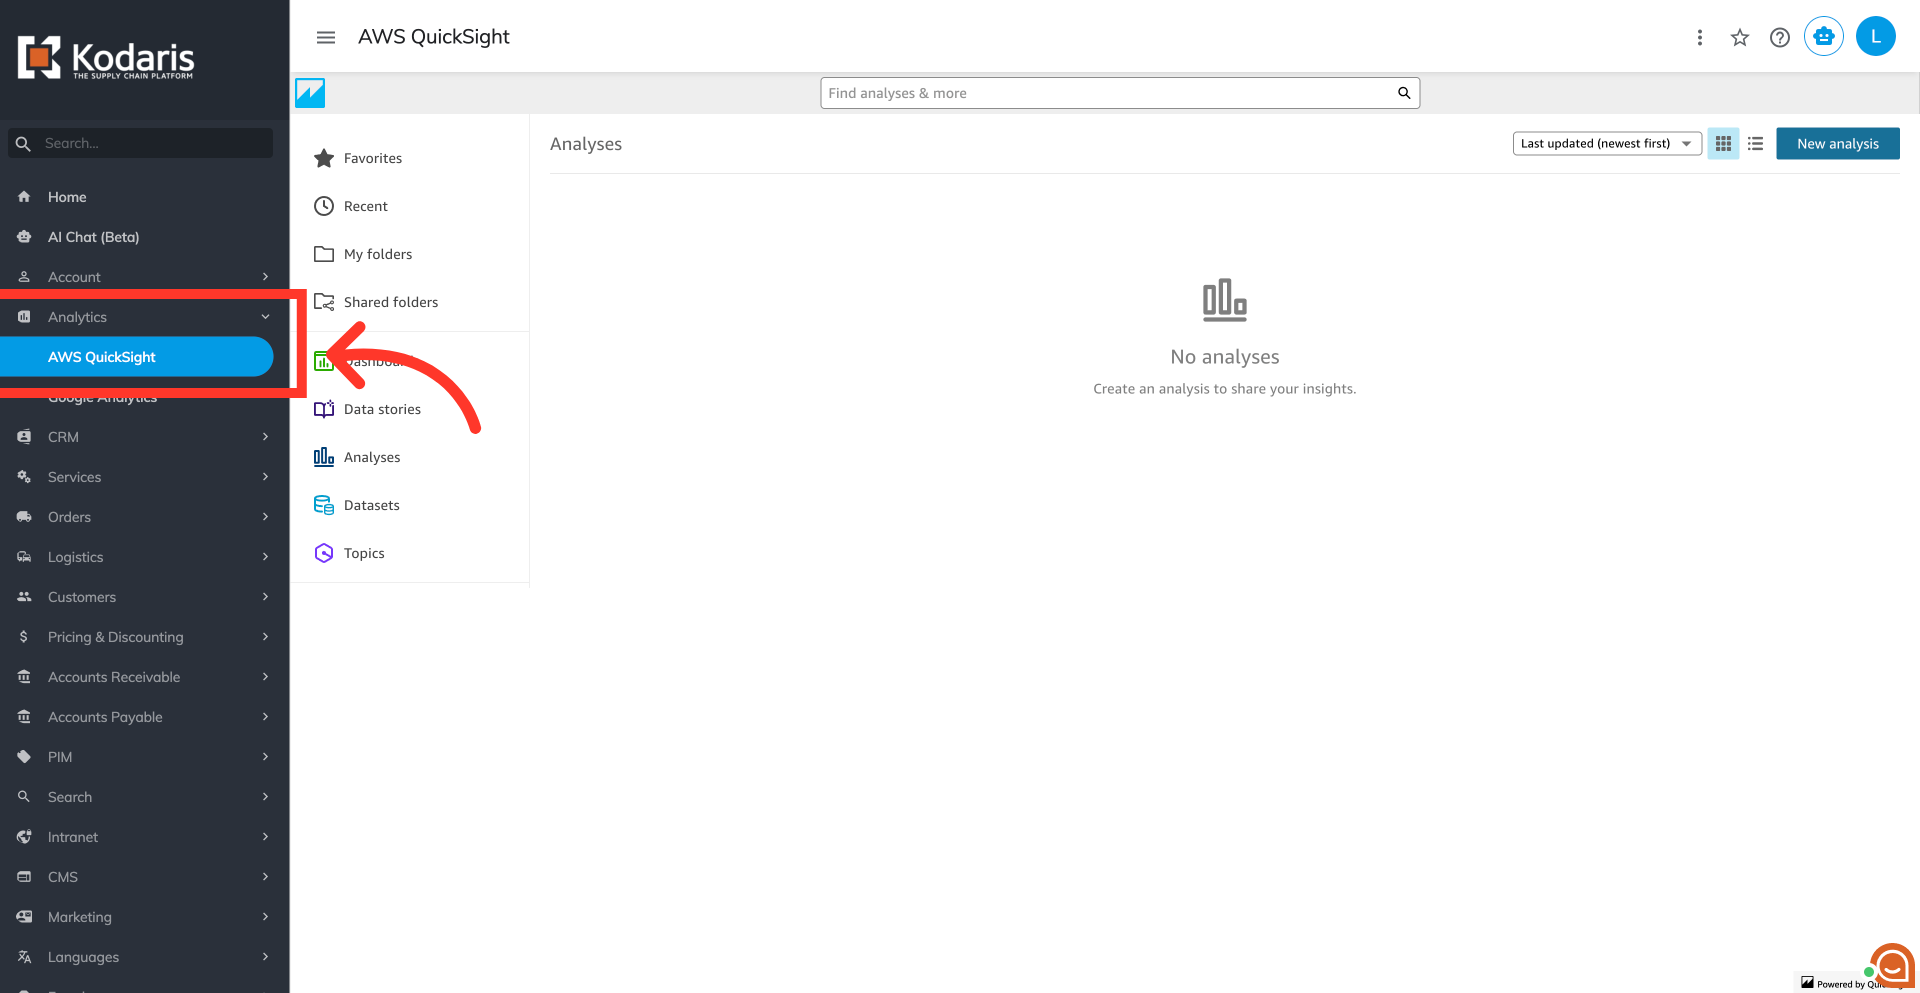
Campaign tracking automatically connects your marketing efforts to customer actions, eliminating manual work. The system generates a unique tracking link for each campaign, which can be either a generic campaign to track all customer activity or a product campaign to track specific item sales, with a sale being attributed as long as the item was added to the cart from the original link. To view this data, go to the "Analytics" section of your operations portal and select the "AWS Quicksight" screen. In order to access "AWS Quicksight” you will need to be set up as a “superuser”, or have the roles of: "qbiAuthor" or "qbiReader".
Go to the "Marketing Campaigns" dashboard
Open the "Marketing Campaigns" dashboard within the "Dashboards" section. Powered by "AWS QuickSight," this dashboard provides a complete record of your campaign's performance.

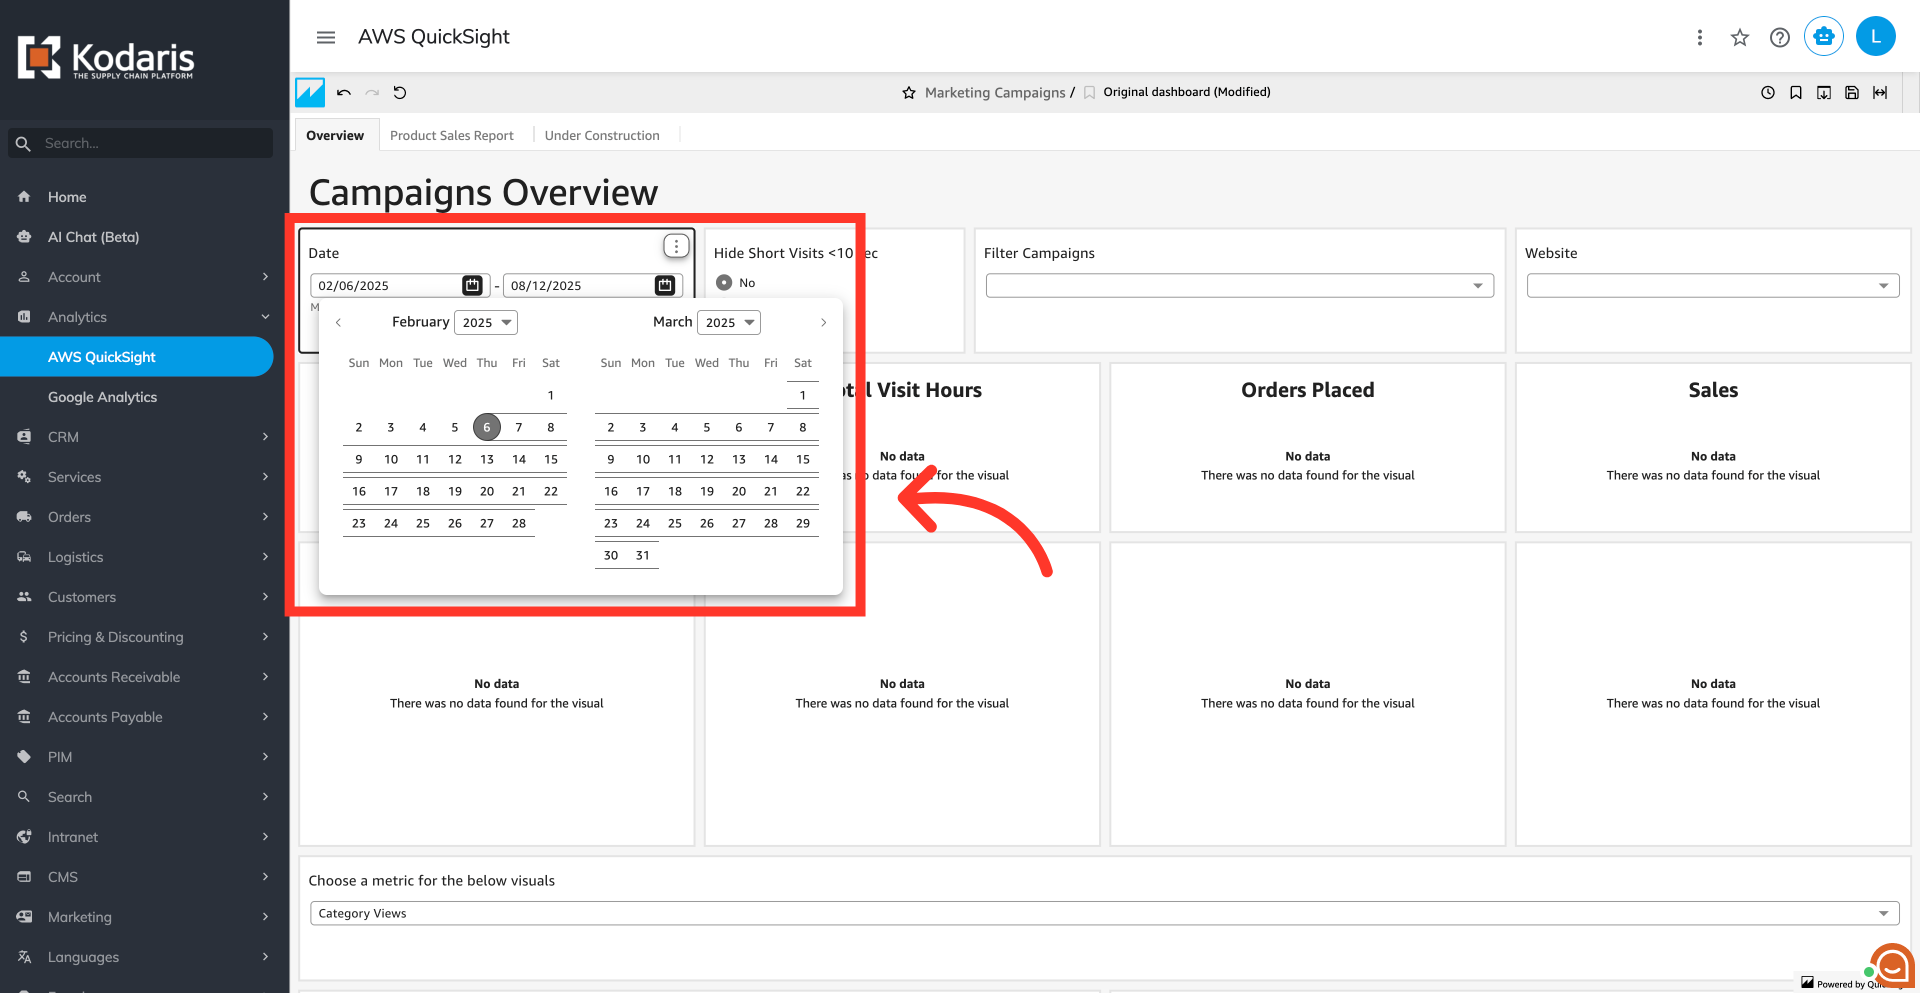
Set a time period
This dashboard also provides a high-level overview of your marketing efforts, displaying key performance indicators like clicks, user sessions, product sales, total session visit time, the number of unique users and more. First, set the specific time frame you want to analyze for your campaign.
Specify your campaign
Next, select one or more campaigns to view their data.

Select your site
Then, choose one or more websites associated with the campaigns to view its data.

Understand key metrics
Once you’ve set up the campaigns you would like to analyze, you'll see a summary of key performance indicators for all your campaigns combined.

User Reach
"User Reach" is the total number of unique users who have clicked on any of your campaign links.

Total Visit Hours
The "Total Visit Hours" card is the combined time, in hours, that all users spent on your site after clicking a campaign link.
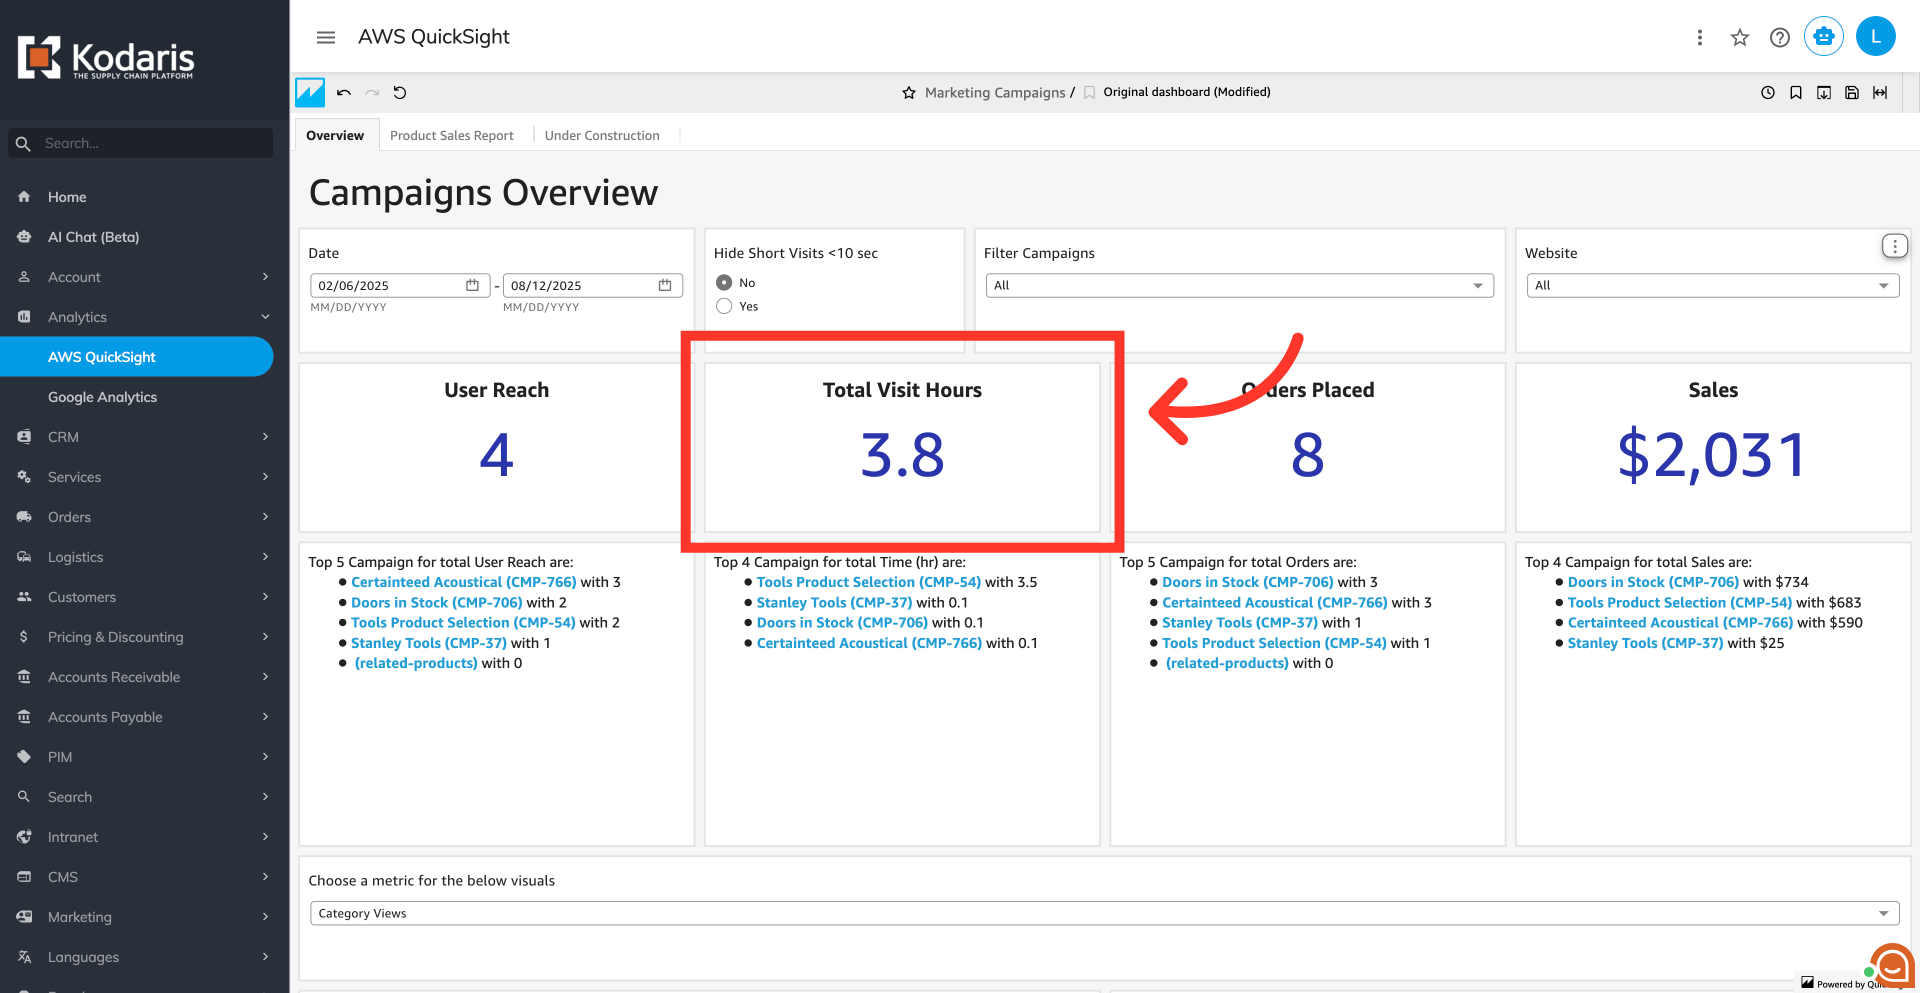
Orders Placed
The "Orders placed" is the total number of orders that were attributed to a campaign.

Sales
This metric shows the total sales dollars generated from orders and sales that are directly linked to the campaign.

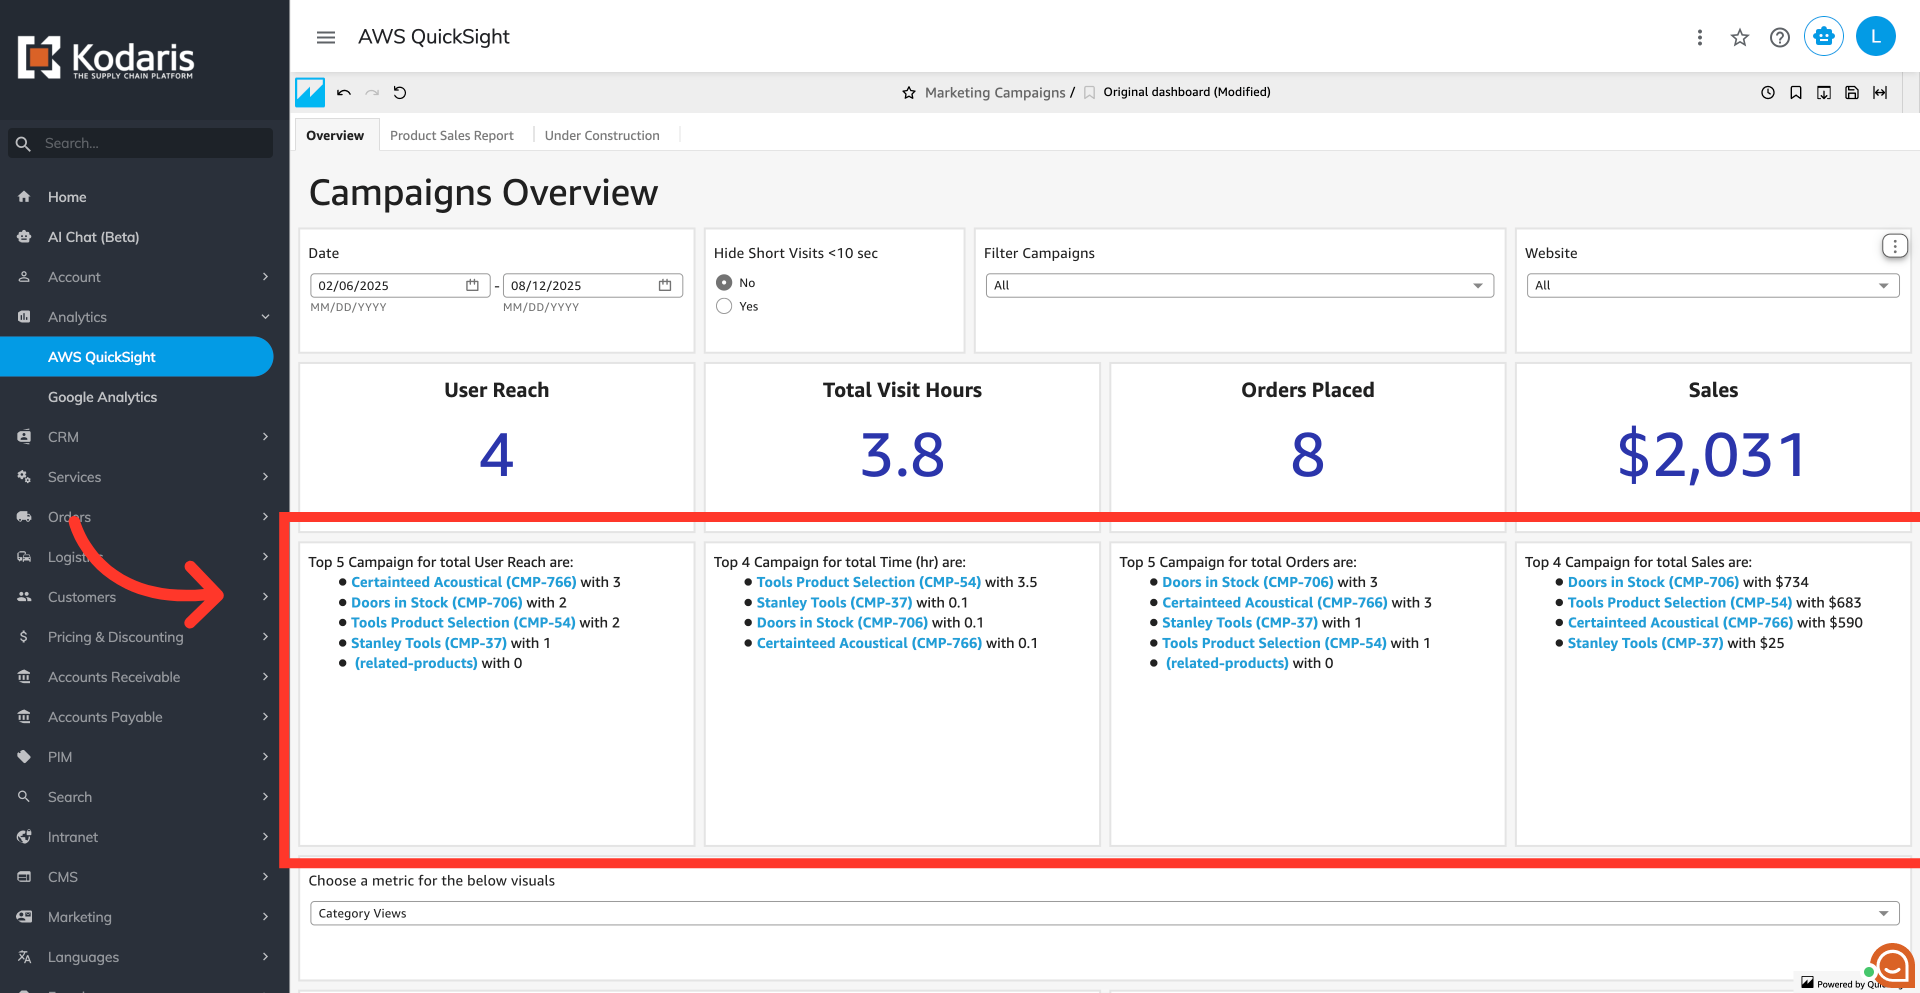
Top-Performing Campaigns
This section ranks your campaigns based on different metrics. This helps you quickly identify which campaigns are performing best in each category such as “Top 5 Campaign for total User Reach,” “Top 4 Campaign for total Time in hours,” and so on.
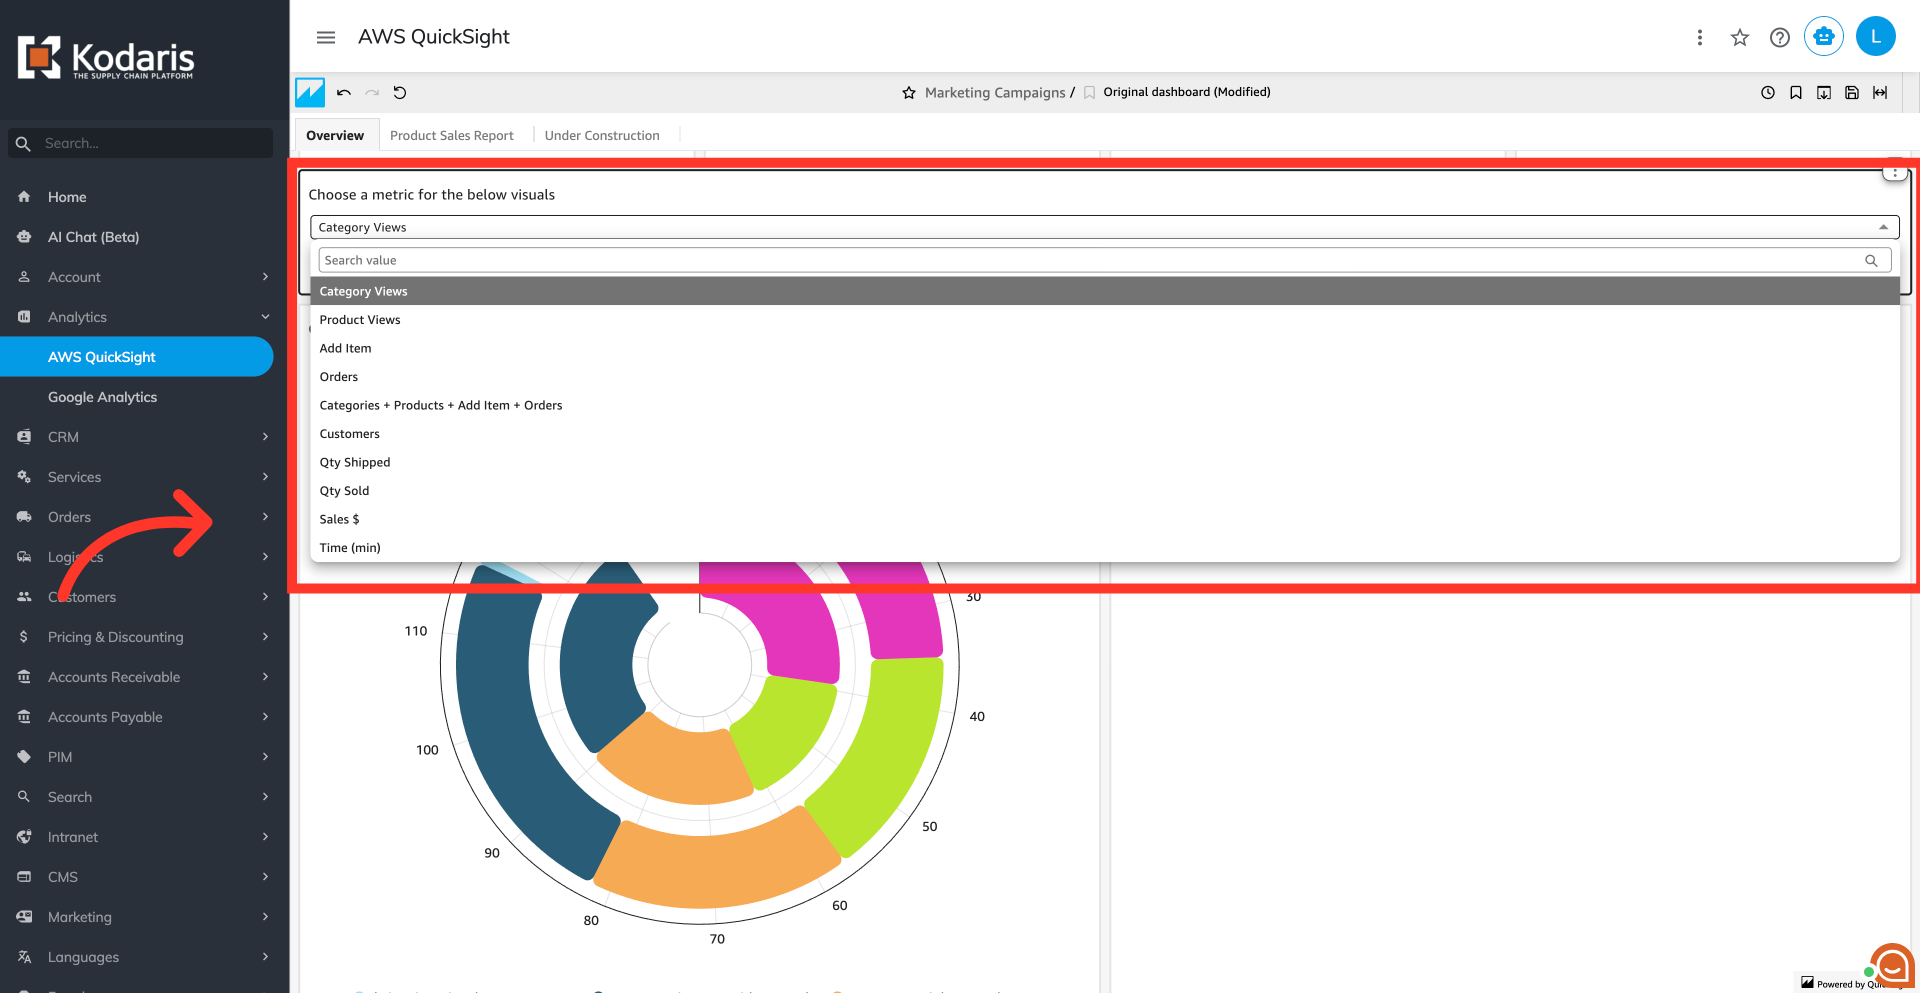
Choose a metric
The campaign performance cards provide a more detailed look at each campaign's performance. Use the dropdown menu to choose a metric for the data shown below. This will adjust the table and chart to show campaign rankings based on your chosen metric, such as "Category Views," "Product Views," "Add Item," "Orders," "Customers," "Quantity Sold," "Sales $," and so on.
Understand your campaign performance
Review these cards to get a complete picture of your campaign's effectiveness. The chart provides a quick visual comparison of key metrics like clicks and actions, while the detailed data table shows specific numbers and conversion rates to help you understand which campaigns are driving the best results.

Access the "Products Sales Report" tab
For a deeper dive into the data, you can access the "Products Sales Report" tab. This report provides a full view of your marketing campaigns, showing a summary of each one, a detailed list of every product sold, and the revenue impact on specific customer orders. A sale is counted for a campaign if the item was added to the cart using a special tracking link.
